aem logo

2023 United States Lightning Report

Overall, the U.S. experienced more than 92 million lightning flashes in 2023, which represents an increase of 6.6% over the prior year. On average, that translates to more than 252,000 lightning flashes per day or about 26 flashes per square mile.

Those flashes were comprised of 558 million lightning pulses, which represents a decrease of 2.5% from the prior year. On average, each flash of lightning was comprised of about 6 pulses.

U.S. lightning metrics

Total lightning flashes
Lightning flash: a collection of pulses close in space and time that approximate the continuous ionized channels of a complete lightning bolt
Total lightning pulses
Lightning pulse: a surge of electric current in lightning, usually accompanied by a burst of light.
92,250,567
Total flashes
Total lightning: the combination of in-cloud and cloud-to-ground lightning activity
68,502,261
In-cloud flashes
In-cloud lightning: occurs between opposite charges within a thunderstorm cloud
23,748,306
Cloud-to-ground flashes
Cloud-to-ground lightning: occurs between opposite charges in a cloud and on the ground
74 %
26 %
558,421,277
Total pulses
Total lightning: the combination of in-cloud and cloud-to-ground lightning activity
503,029,732
In-cloud pulses
In-cloud lightning: occurs between opposite charges within a thunderstorm cloud
55,391,545
Cloud-to-ground pulses
Cloud-to-ground lightning: occurs between opposite charges in a cloud and on the ground
90 %
10 %

State & county lightning metrics

Total lightning flash density by state
Number of lightning flashes per square mile per year
Total lightning flash density by county
Number of lightning flashes per square mile per year
Total thunder hours by state
Number of hours in which lightning was detected within an area
Total thunder hours by county
Number of hours in which lightning was detected within an area
Dangerous Thunderstorm Alerts by state
AEM-patented warnings based on storm cell flash rates
MAP TOP 10 OUR TAKE

As the lightning capital of the United States, Florida continues to have the highest concentration of lightning activity in the U.S.  

Nine of the top 10 states with the highest concentrations of lightning are situated in areas known for their lightning activity, including the Gulf Coast, the Southeast, and the Great Plains regions. The only state that is not from one of these three regions is Missouri, which dislodged South Carolina from the top 10 this year. More than two dozen counties across Missouri experienced above-average rainfall over the past year.

As the lightning capital of the U.S., seven of the top 10 counties with the highest concentration of lightning activity are in Florida. But the top county with the single-greatest density of lightning activity is St. Bernard Parish in Louisiana.  

Besides Florida, the remaining three spots in the top 10 are occupied by three counties in Louisiana and Mississippi (all located along the Gulf Coast in the Mississippi Delta region). Last year’s top contender, Poquoson City, Virginia, disappeared completely from the top 10, which underscores the extreme concentration of lightning in the Florida and Gulf Coast counties.

While lightning flash density indicates the concentration of lightning activity in a region, total thunder hours indicate how that lightning was distributed over time. Since the average storm lasts for about an hour, the thunder hour provides an ideal level of granularity for estimating the “storminess” of an area or how frequently an area must deal with lightning risk. 

It’s no surprise that states like Texas (due to its size) and Florida (as the lightning capital of the U.S.) rank among the top states with the most thunder hours. But Hawaii and California are among the top 10 states with the most thunder hours, even though they are among the bottom 10 states for lightning flash density. These are states that tend to have large numbers of storms, but each storm tends to have less lightning activity. 

As the lightning capital of the U.S., five of the top 10 counties with the most thunder hours are in Florida. The remaining counties, however, are not from any of the lightning hotspots in the Gulf Coast or Southeast. They are from Hawaii, Wyoming, Nevada, and Arizona.

In keeping with the rest of Hawaii, Honolulu County’s thunder hours can be traced to the area’s large number of storms with mild lightning activity. The remaining counties are among the top 30 in land area, which illustrates how the size of larger areas can skew lightning counts in their favor, even when they have lower concentrations of lightning activity.

Dangerous Thunderstorm Alerts (DTAs) are AEM’s patented severe weather warnings. When the lightning flash rate of a thunderstorm cell exceeds a high enough threshold to indicate that it poses a material threat to life and property, a DTA is automatically issued. The number of DTAs issued in an area correlates closely with the number of high-intensity thunderstorms.

As one might expect, Texas leads the list because of its large land area. But the other states on this list also appear in the top ten for lightning flash density. In other words, the states with the highest concentrations of lightning also tend to have the largest numbers of intense thunderstorms.

Thunder hour anomalies

Thunder hour anomalies
The degree to which the most recent year's thunder hours deviated from the climatological trend

It’s worth noting that negative anomalies (i.e., where there were fewer thunder hours than in the past) extended across the Midwest into the Southeast seaboard, as well as northern Florida and the Mississippi Delta region. We also see a pocket of negative anomalies in the Southwest. As of December, all these areas were experiencing varying degrees of drought. 

At least some of the positive thunder hour anomalies (i.e., where there were more thunder hours than in the past) in the West and the Great Plains can be traced to the repeated atmospheric rivers that inundated these areas with rain and snow during the early months of 2023 and to “heat domes” that brought severe weather to their peripheries over the summer.  In New England, the increase in thunder hours can be partly attributed to an exceptionally active summer storm season that brought flooding and more tornadoes than the region has seen during any year in the past decade.

2023 lightning highlights

Lightning data provides important insights into weather and climate across the United States. In this portion of the report, we will focus on the close relationships between lightning and some interesting meteorological events. The following case studies discuss several interesting weather events from 2023 and their noteworthy lightning activity.
California gets rare thundersnow
July heat spreads severe weather
Exceptional thunderstorms spark Alaska fires

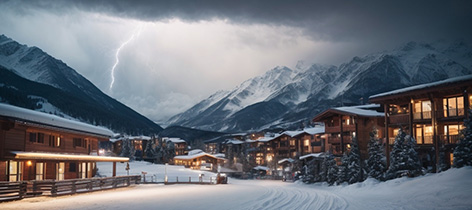
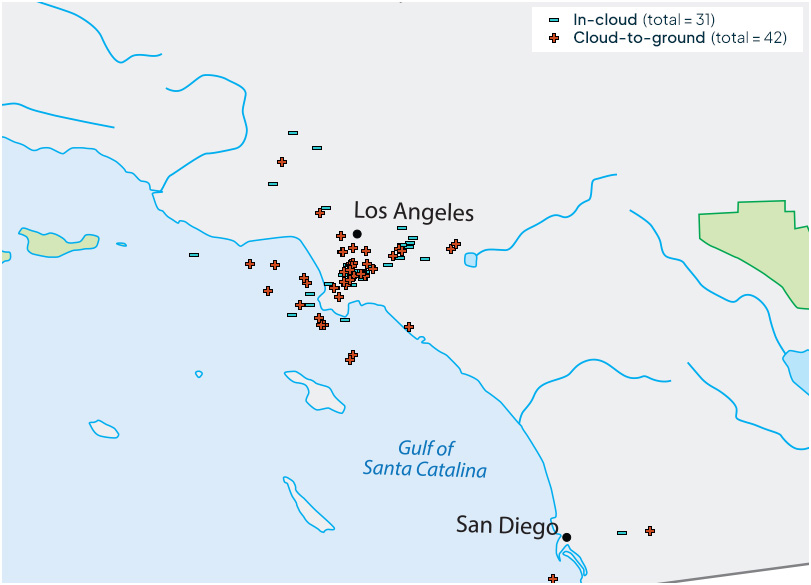
Snow in southern California is a relatively rare sight. Thundersnow is even rarer. Yet, that’s exactly what residents outside Los Angeles got to experience on February 25. 

It’s been estimated that thundersnow accounts for less than 0.1% of all U.S. snowstorms. The reason for this rarity is that lightning and snowstorms are generally caused by very different atmospheric conditions.  

Lightning is caused by conditions of atmospheric instability in which warm air rises rapidly into the cooler air above it. In contrast, most snowfall occurs in conditions where the air near the ground is nearly as cold as the air above it. For comparison, a typical thunderstorm has air rising at more than ten miles per hour, while the most severe snow bands tend to have air rising only at two miles per hour. 

However, under the right circumstances, a cold air mass may come into contact with warm, moist air to produce both the conditions that are favorable to creating snow and the convection needed to generate lightning. This is exactly what forecasters in southern California predicted for February 25, when a cold air front dropping down along the California coastline was projected to collide with the warm, moist atmospheric river from the Pacific. 

However, the atmospheric instability that gives rise to thundersnow also tends to result in higher snowfall rates. And that’s exactly what we saw in this case. In addition to producing 337 lightning pulses (as measured by AEM’s Earth Networks Total Lightning Network), the storm brought snowfall to elevations as low as 1,000 feet (305 meters) and rare blizzard conditions to the mountains outside Los Angeles.

July 2023 has gone down as the hottest month the globe has ever recorded. It also set a U.S. record: the July with the most severe weather reports – 6,637 to be exact. These two records are closely connected.

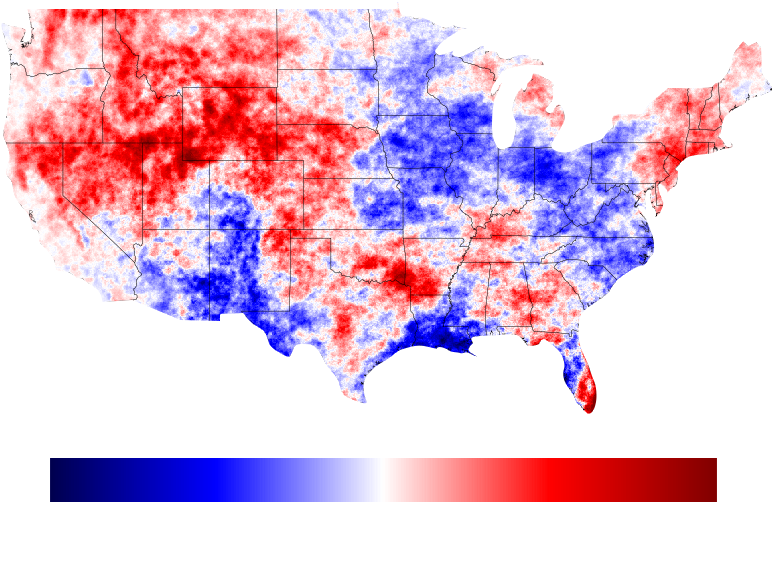
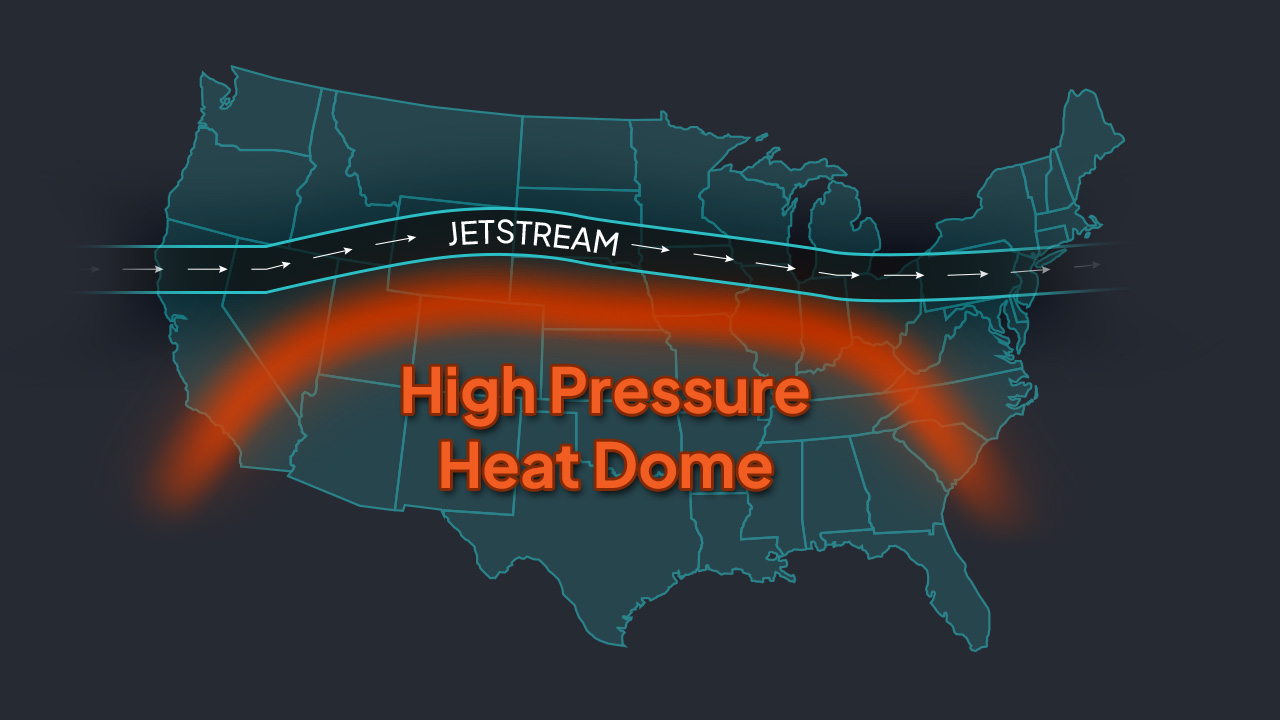
In July, a series of high-pressure ridges, colloquially known as heat domes, settled over Europe, Asia, and North America, driving up temperatures. While heat domes form every summer, it is uncommon to see so many forming simultaneously. And, the North American heat dome, which spanned across the entire southern tier of the U.S., was exceptional for its strength and duration.

Thunderstorms tend to form at the edge of heat domes, where the dome’s hot air mixes with cooler air from outside. In the case of the U.S. heat dome, the jet stream was able to pick up moisture pooled against the Rockies and carry it eastward along the edge of the dome to create a sort of “storm superhighway.”

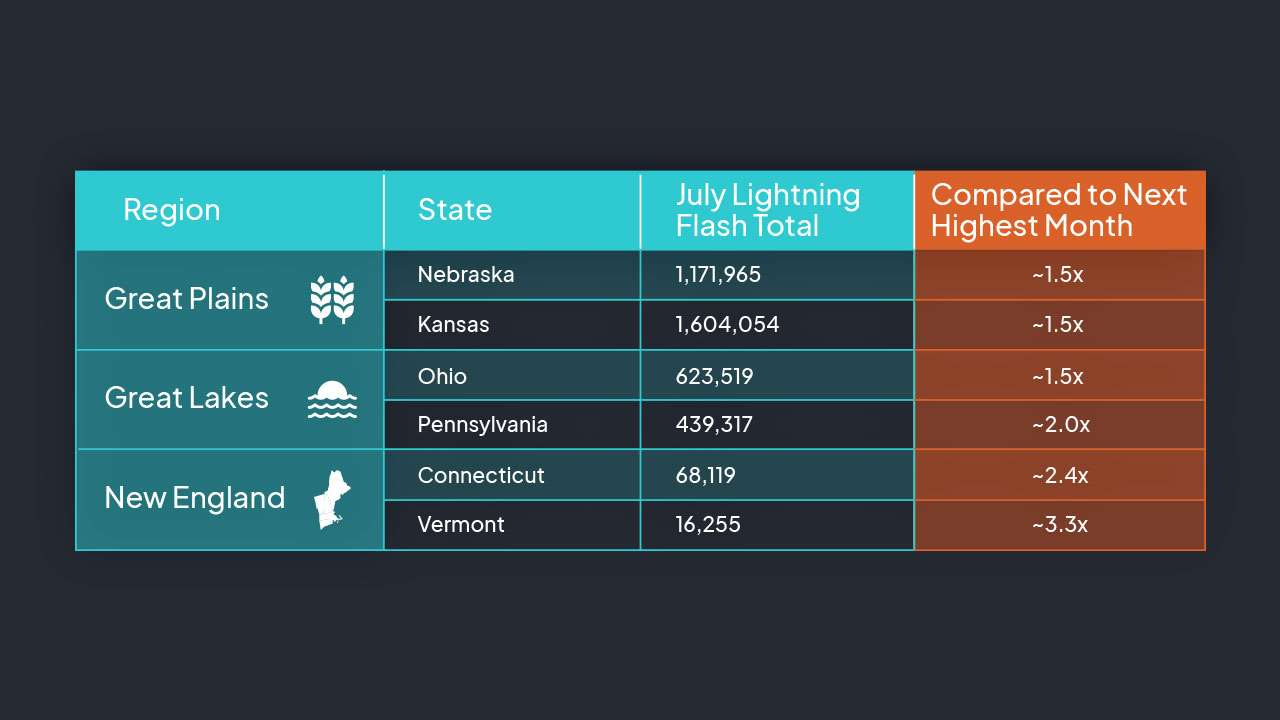
Unfortunately for the Great Plains, the Great Lakes, and the Northeast regions, they were in the path of this highway. As a result, these regions experienced a significant amount of severe weather.

To appreciate just how much of an impact the July heat dome had, we looked at July lightning activity in a series of periphery states and compared that to each state’s lightning activity across all other months. What we found was that these states experienced 1.5-3.3 times as much lightning activity in July as they did during their next-highest month for lightning activity.

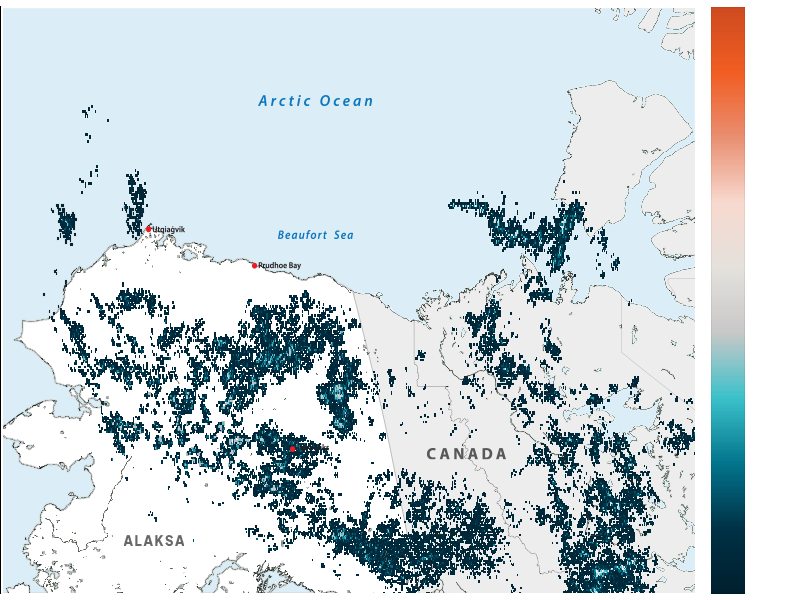
The same heat domes that broke global temperature records in July also brought exceptional, prolonged heat to Alaska. In Fairbanks, temperatures ran about 3.7 above average for the month. In Utqiaġvik, the northernmost city in Alaska and the U.S., highs were running about 25 degrees above average.

That exceptional heat produced exceptional thunderstorms. The University of Alaska in Fairbanks reported that over 20,000 lightning strikes were recorded over Alaska and neighboring territories in Canada from July 24-25. Throughout July 24, AEM’s ENTLN recorded 23,616 lightning pulses, which comprised 16,505 flashes.

Thunderstorms occur routinely in Alaska, but lightning activity of this magnitude is rare.  Remember that Alaska ranks last among all U.S. states for lightning density. And even though it dwarfs all other states in terms of land area, it still ranks in the bottom 10 for its total lightning count. The lightning activity from that single 24-hour period accounted for about 31% of the state’s entire lighting activity for the month of July, and July far surpassed any other month for lightning activity in Alaska (about 1.7 times that of the next-most-active month).

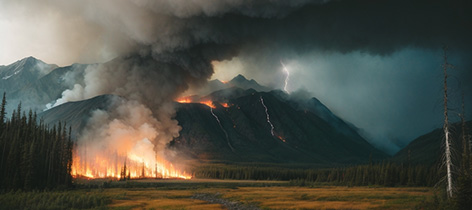
The lightning strikes sparked about 30 new fires across Alaska. As a result, Alaska’s total burned area quickly shot from 2,000 acres on July 20 to more than 290,000 acres by August 17. The percentage increase was astounding (+14,400%). But, luckily for Alaska, a series of other factors conspired to make this year’s fire season and total burn area one of its smaller ones. 

While a lightning storm of this magnitude may be exceptional  in Alaska, it may become less exceptional in the future. As the climate warms, researchers predict Arctic lightning could double by the end of the century.

About this report

The 2023 U.S. Lightning Report was prepared by our team at AEM using our proprietary Earth Networks Total Lightning Network® (ENTLN).

The ENTLN has been developed specifically to detect lightning in real time and to provide advanced warnings for severe weather events that could threaten public safety and operational efficiency. The ENTLN is the most extensive and technologically advanced lightning network in the world. With more than 1,800 sensors, the network provides exceptional baseline lightning detection around the globe. In regions with higher sensor density, the network’s lightning detection efficiency climbs above 95%.

The report includes in-cloud, cloud-to-ground, and total lightning data throughout 2023 from the United States and the surrounding bodies of water. Counts, densities, rankings, Dangerous Thunderstorm Alerts (DTAs), and thunder hours in this report are from January 1, 2023, to December 31, 2023.

GET IN TOUCH!
Talk to a lightning expert
Every day we help companies protect assets, improve operations and plan for every environmental event. Let us show you how.