A SOLUTIONS EBOOK

Best Practices in Action

Examining What Distinguishes Leading
Flood Warning Systems
CHAPTER
0 1

Best practices for managing flood warning systems

Through our exploration of how three very different flood warning systems respond to three very different flood events, we identified several practices that are shared among them. Listed below are the six best practices that help to make these systems so effective.

It’s important to remember that each flood warning system operates within a unique organizational and hydrometeorological context. Although different flood warning systems may observe the same core set of best practices, we can see them applying these practices in different ways to fit their unique contexts.

1
Utilize multidimensional analysis

All of the systems we looked at incorporate a wide range of variables to better understand and anticipate flood-related threats. All of them incorporate data related to incremental and cumulative rainfall, as well as current water levels and/or flood stages. In some cases, they may also look at forecast information from the National Weather Service or observations from local weather stations. With regard to local weather station observations, some systems may incorporate data such as wind speed and wind direction.

The point is that meaningful analysis and prediction of water levels requires measurement of more than just water levels. However, there may be some variability in what those additional data points need to be, depending on your precise geographic and hydrometeorological situation.

2
Be collaborative

Collaboration refers to both the giving and receiving of data. All the flood warning systems we highlight tap into data from outside agencies and/or from outside their boundaries. In addition, all of them have been built around the objective of sharing flood-related information with emergency responders and the general public. Collaboration serves as both the purpose and the provenance behind the top flood warning systems.

3
Keep eyes on the field

Whether it’s through cameras or through human patrols, it’s important to have eyes in the field that can second-guess the data coming in and provide context for it. In some cases, water level sensors can return inaccurate data, or the data may not tell the whole story of what is happening in the field. Visual field observations can correct for these issues or confirm what the data is telling you. The main advantage that cameras have over human patrols is that they are “always on” and can provide real-time checks on the data being received.

4
Look beyond your boundaries

To anticipate flood threats before they hit, it’s important to tap into hyperlocal water and weather information from adjacent areas. This may include weather station data from areas that lie upwind from your district, or it may include water level data from areas that lie upstream. Either way, the data enables you to anticipate what is coming your way. That’s why communities like Fort Worth and Santa Cruz County take the initiative to get access to these outside data sources. In North Carolina, the statewide flood warning system makes it easy for municipalities and counties to look beyond their boundaries.

5
Automate alerts to anticipate what’s happening before it actually happens

Don’t allow flood conditions to sneak up on you before you are aware of them. Set alarms that make you aware of what’s happening before flooding ever happens. This may include setting alarms for approaching inclement weather. It may also include setting alarms for when rising waters cross certain pre-flood thresholds. It could involve setting alarms for upstream activity that takes place outside your boundaries.

6
Continually evaluate and improve upon your warning system

North Carolina assesses field equipment and the operational effectiveness of their network before and during events to ensure that data is available when it’s needed. Both Santa Cruz County and Fort Worth make it their policy to review their response after each flood event to understand what went right and where there may be room for improvement. While the precise approaches differ, they all share the same objective of iteratively improving upon their flood warning systems.

Read on to see how some of the leading flood warning systems in the United States put these best practices into action during flood events. It will give you a deeper, more contextual understanding of the best practices, so you can fully adapt them to your unique situation, and make them your own.
CHAPTER
0 2
Figure A: Fort Worth, Texas

Fort Worth gets a full season of rain in one day

Hydrometeorological context

Even in a state like Texas, where flash flooding is the number one cause of weather-related deaths, Fort Worth stands out as especially susceptible to flooding. It is among a handful of cities situated along an area ominously known as Flash Flood Alley.

Much of the area’s rainwater gets channeled into the Trinity River. Extreme flooding of the Trinity River occurred eight different times from the mid-1800s through the 20th century. To help contain the river’s floodwaters, an elaborate system of levees was constructed, starting in the mid-20th century. But even with the levee system, smaller flash floods from urban creeks and undersized storm drains remain a regular occurrence.

Figure A: Fort Worth, Texas
August 2022 Fort Worth historic rain event

On August 21-22, 2022, the Dallas/Fort Worth area experienced an historic rainstorm. A stationary front had settled across northern Texas, extending through Fort Worth and into Louisiana. And that front was about to be recharged with tropical moisture from the Gulf of Mexico.

Ultimately, the Dallas/Fort Worth area would receive 9.19 inches of rain over 24 hours, according to official records from the National Weather Service. However, the rain was not evenly distributed. Isolated areas to the east received more than 15 inches while a rain gauge in Fort Worth recorded 8.60 inches.

For perspective, 9.17 inches in 24 hours is considered a 100-year rainfall for Tarrant County, where Fort Worth is located. This was the second largest 24-hour precipitation amount the area had received since recordkeeping began in 1914. In fact, average rainfall across the area for an entire summer is only about 7.38 inches, which means the area received more than its entire seasonal average within a single day.

PHOTO:
Courtesy of Fort Worth Stormwater Management
Data from the city’s rain gauges, as visualized through AEM’s Contrail® platform, show two distinct waves of rainfall during the event. As Figure B illustrates, 7.87 inches of rain fell across two days at this particular site. However, that rain was not distributed evenly over time. More than 2.9 inches fell in just a two-hour timeframe beginning at 10 pm on August 21. From there, the rain died down for a few hours. But when it returned, there were seven successive hours of increasingly intense rainfall.
Figure B: Hourly rain increments (inches)
(View data source)
SOURCE:
Contrail / Fort Worth Flood Warning Sensor Network
Water level increases in the Trinity River trailed slightly behind rainfall. In Figure C, we can see a sharp rise in water level just after the initial two hours of intense rainfall. The water level then leveled off until about 10 am on August 22. It began to rise again just as the second wave of rain hit its peak. From there, the water level continued to rise gradually until cresting around midnight on August 22.
Figure C: Trinity River stage at Greenbelt Ave.
(View data source)
SOURCE:
Contrail / Fort Worth Flood Warning Sensor Network
As the Trinity River rose, Fort Worth experienced widespread flooding with at least 27 instances of water rising over roads. Figure D, captured from the city’s Contrail platform, provides an indication of just how many sites already had passed or were approaching flood stage – with about 12 more hours of rising water still to come.
Figure D: Fort Worth flood status
(View data source)
SOURCE:
Contrail / Fort Worth Flood Warning Sensor Network

There have been differing reports on the exact magnitude of the flood’s impact. The Fort Worth Report stated that fire and police departments responded to 156 calls related to flooding – many from stranded motorists on flooded roads. However, other reports indicate the flood impact and response may have been even greater. At about 4 pm on August 22, the Fort Worth Fire Department Tweeted that there had already been 500 calls for service and 174 high water investigations/rescues.

Why the response was remarkable: How partnerships, camera technology, and automated alerting saved lives in Fort Worth

Despite numerous reports of flooded roadways and stalled vehicles, the city did not suffer a single fatality. A portion of that credit goes to the city’s Stormwater Management team.

Fort Worth’s Stormwater Management, a division of the city’s Transportation and Public Works department, is tasked with the mission of protecting people and property within the city from harmful stormwater runoff, including flash flooding. The City’s stormwater management program manages flood risk by making structural improvements through capital projects, the review of private development drainage plans, proactive maintenance of the drainage system, and real-time flood warning.

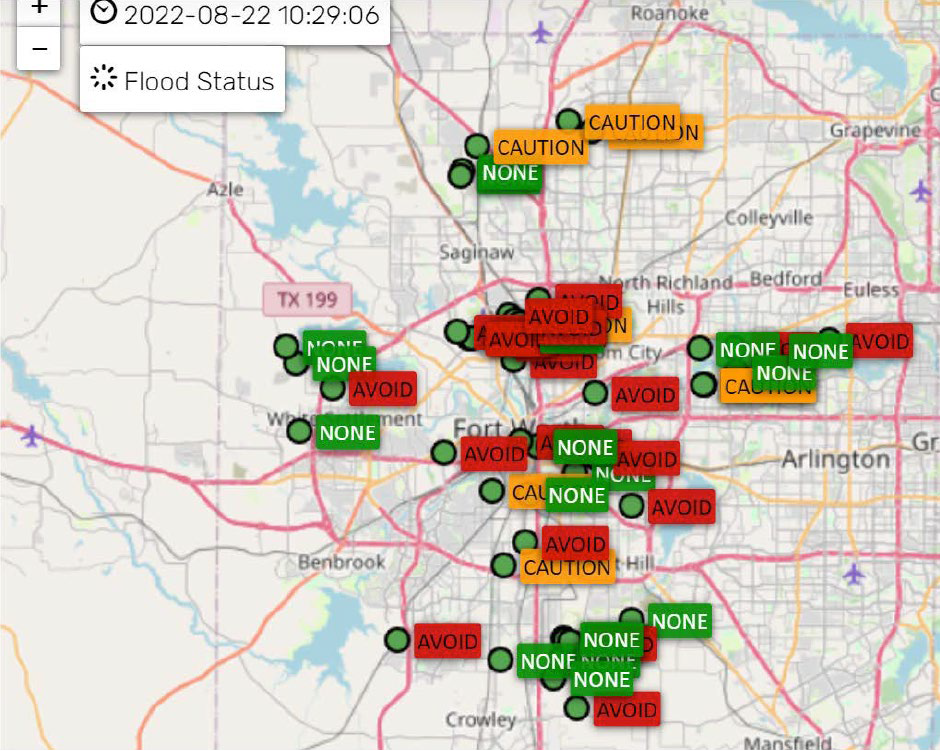
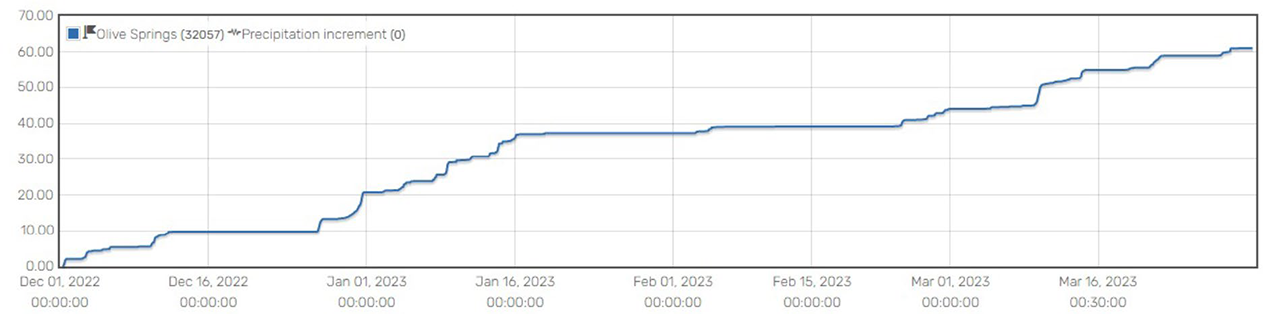
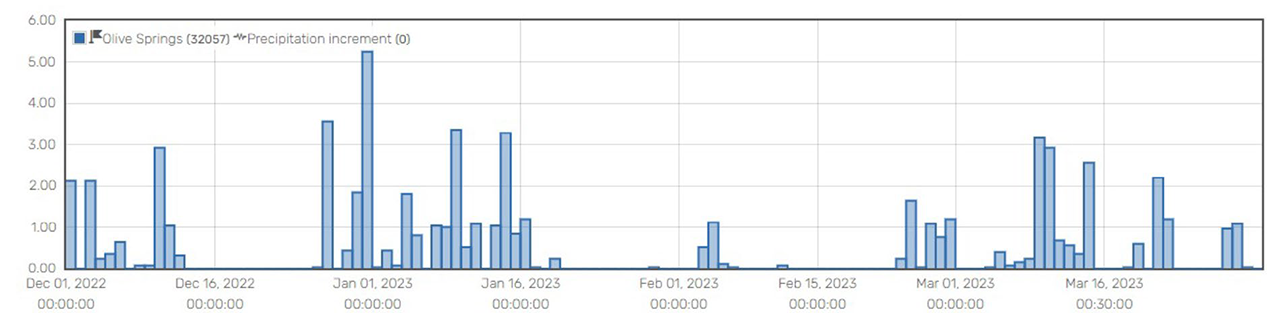
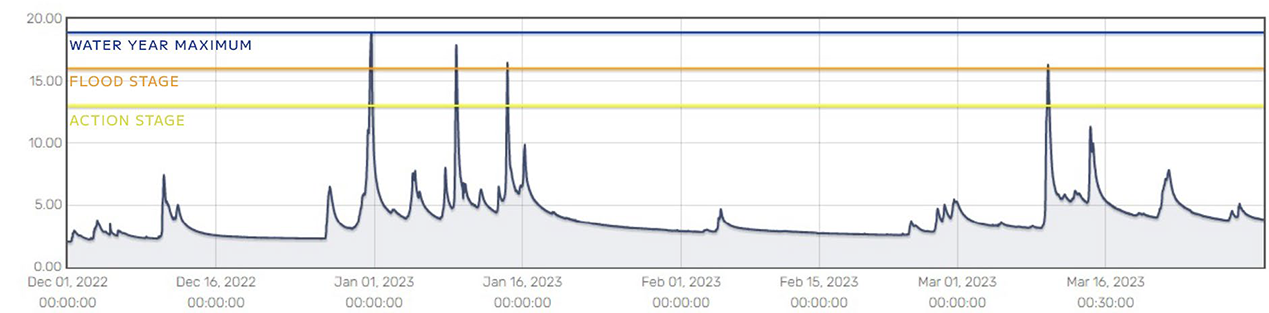
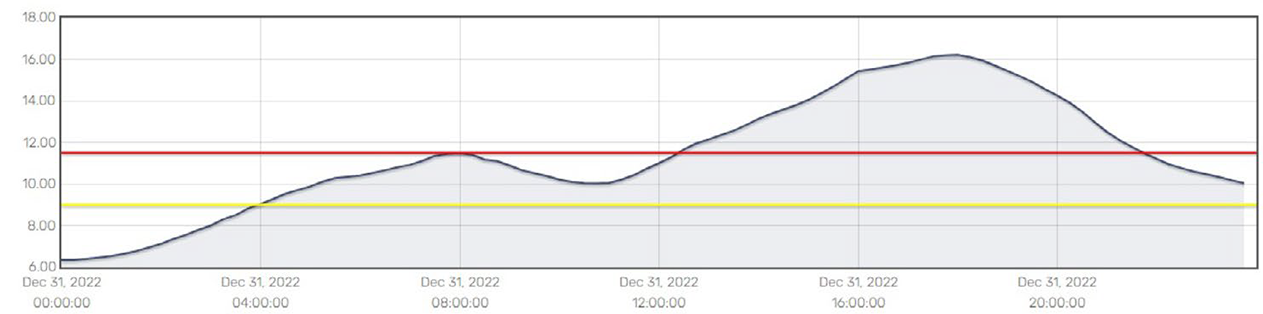
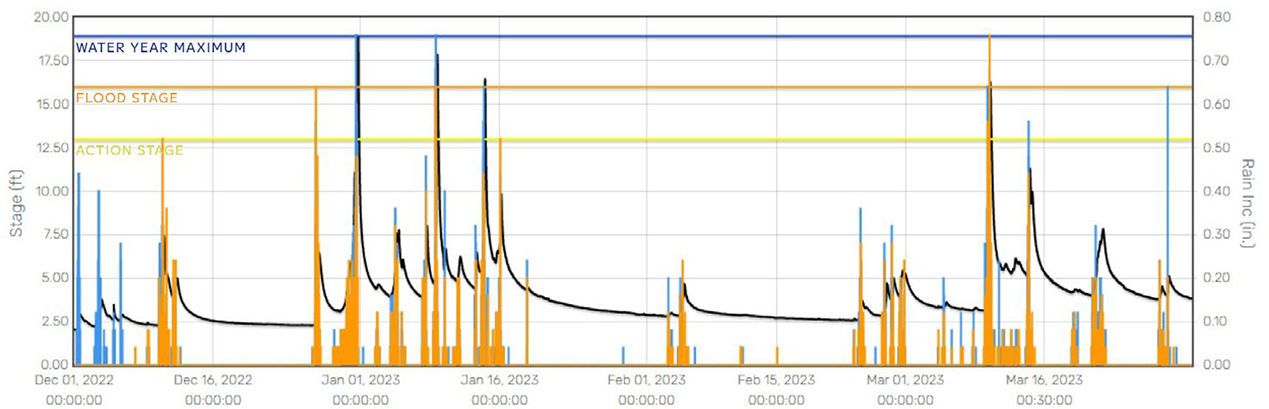
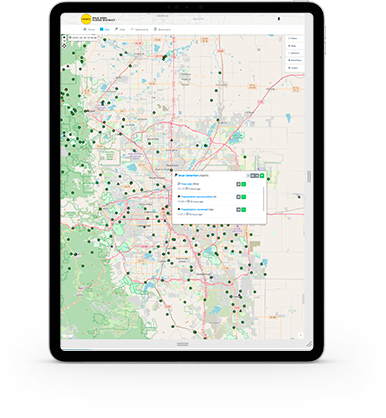
With regard to flood warning, Stormwater Management provides weather and flood-related notifications to the city’s emergency responders. They also deploy field crews that are responsible for barricading flooded roadways and reopening roads as the water recedes. To help manage these functions effectively, the stormwater group oversees the city’s Flood Warning sensor network, which utilizes AEM’s Contrail platform for storing, visualizing, analyzing, and sharing critical data about precipitation and water levels.
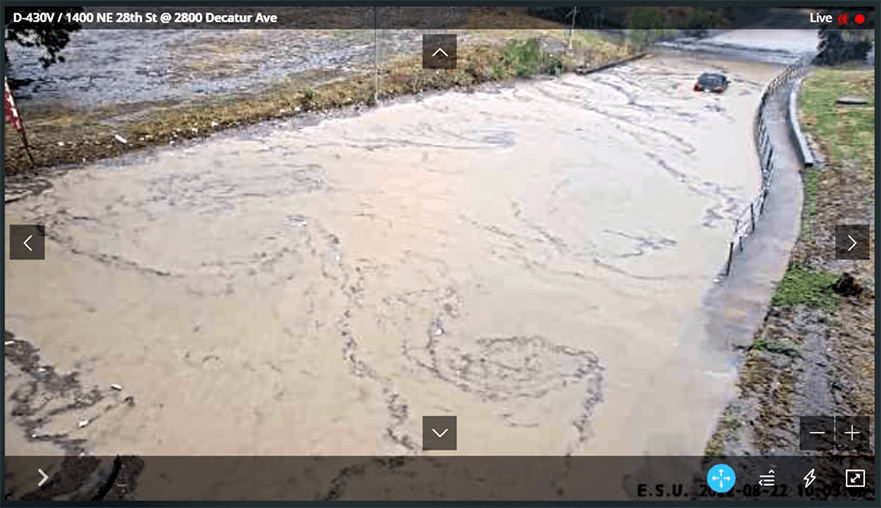
PHOTO:
Courtesy of Fort Worth Stormwater Management
Stormwater Management has adopted several practices that enable them to respond faster and more effectively to flood-related threats before, during, and after their occurrence. Here are some of the main ones:
1
Multidimensional risk assessment

Stormwater Management monitors a wide range of variables to better understand flood-related threats. To accomplish this, they maintain a large network of rain gauges, water level sensors, and weather stations. This is supplemented with rainfall data that they collect through a mix of conventional radar and low-atmosphere, high-resolution radar.

2
Looking beyond city boundaries

To better anticipate severe weather before it hits, Fort Worth ingests data from neighboring communities and the Tarrant Regional Water District. Those arrangements provide access to critical weather station data beyond city boundaries, so the city can supplement forecasts from the National Weather Service with hyperlocal data. This supplemental data gave the team a much better sense of the storm system they were facing as it approached in August.

3
Real-time automated notifications

Stormwater Management has set up an extensive notification network. When a severe weather system is approaching, notifications will be sent to field crew supervisors and any other subscribers. They also utilize real-time notifications for changing water levels.

Fort Worth maintains a network of water level gauges at or near locations where roads cross or pass by waterways. They have defined thresholds at two feet below flood level, one foot below flood level, a half foot below flood level, and at flood level. Every time a gauge reading crosses one of these thresholds, it triggers an automated alert to notify crews. In addition to the notifications that go out to crews, roadside flashers get triggered to alert drivers when water levels reach flood stage.

In August, these notifications enabled crews to identify in real time where streams were rising, so they could pre-deploy to the locations where they were most likely to be needed. It helped to ensure that crews would be able to barricade flooded roadways promptly. And the flashers helped to ensure motorists' safety even before crews arrived.

4
Remote visual confirmation of flooding

In addition to its gauge network, the city has begun deploying cameras at key locations. The cameras can provide visual confirmation of flooding even before crews are deployed to a site. This enables Stormwater Services to better prioritize crew deployments while providing faster confirmation of flooding to Emergency Operations.

Figure E: Contrail Camera image from Decatur Ave. @ 28th St.
SOURCE:
Contrail / Fort Worth Flood Warning Sensor Network
5
Post-response evaluation and analysis

Following a flood event, the Stormwater Management team has a formal process in which they scrutinize what went right and what went wrong, so they can improve their response to the next event. Based on learnings from the August event, they are expanding roadside flood signage and using the city’s emergency notification system to inform the public with targeted flood warnings.

It was this operating approach that enabled Fort Worth Stormwater Management to anticipate and respond so effectively to the many flood-related threats that occurred over August 21-22. Their use of the city’s flood warning system greatly assisted the flood monitoring and response efforts – and likely played an important role helping the city avoid any fatalities.
CHAPTER
0 3

Sustained winds flood North Carolina’s Outer Banks

Hydrometeorological context

The Atlantic coastline of North Carolina includes dozens of long, narrow barrier islands. Among them are the Outer Banks, a thin island chain that has been built up over the years to include a number of small towns, many of which have become vacation hotspots. To the east of the Outer Banks lies the Atlantic Ocean. To the west is a series of shallow estuaries that make up North Carolina’s sound system. Like other barrier islands, these rise less than 20 feet above sea level.

Figure A: Outer Banks, North Carolina

From the ocean side, the Outer Banks are vulnerable to flooding from storm surges generated by hurricanes, tropical storms, Nor’easters, and other severe weather. They are also vulnerable to sound-side flooding from normal astronomical variations in the high tide and from sustained winds that can cause coastal waters to swell to flood levels.

From the ocean side, the Outer Banks are vulnerable to flooding from storm surges generated by hurricanes, tropical storms, Nor’easters, and other severe weather. They are also vulnerable to sound-side flooding from normal astronomical variations in the high tide and from sustained winds that can cause coastal waters to swell to flood levels.

Figure A: Outer Banks, North Carolina
North Carolina’s December 2022 coastal flooding event

According to the National Weather Service, a low-pressure system moved northward into North Carolina on Thursday, December 22, bringing 1-3 inches of much-needed rain to much of eastern North Carolina and the Outer Banks. The winds and rain associated with this front caused some minor water level increases in several rivers off the Pamlico Sound. As the system continued to move north, it eventually merged with a stronger low-pressure system moving east through the Great Lakes.

Throughout Friday, December 23, the newly merged system pulled a cold front across the state. That front brought strong sustained winds out of the west. The winds blew across portions of eastern North Carolina and the barrier islands for 6 to 12 hours and included gusts of 50 to 60 miles per hour. The sustained high winds caused water levels to drop in some of the mainland rivers and swell along the sound-side shores of many of the barrier islands.

We can clearly see how this event unfolded by looking at data from the North Carolina Division of Emergency Management’s Rain and Stream Gage Monitoring Network, which is stored and visualized through AEM’s Contrail platform. Figures B through D highlight key data points collected at the Cape Hatteras U.S. Coast Guard Station.

Figures B, C, and D illustrate how the water level at Cape Hatteras continued to fall from 1:30 pm until about 4:30 pm on December 22, which is about the same timeframe the winds out of the south began to pick up. After that, winds died down and the water returned to a more normal level until about 11:30 am on December 23. From there, the water level continued to climb with winds out of the west until it reached about six inches above flood stage, and it remained above flood stage for about the next 12 hours. The water level did not begin to recede until the winds began to calm down.
Figure B: Water level at Cape Hatteras U.S. Coast Guard Station
SOURCE:
Contrail / North Carolina Rain and Stream Gage Monitoring Network
Figure C: Wind speed (mph) at Cape Hatteras U.S. Coast Guard Station
SOURCE:
Contrail / North Carolina Rain and Stream Gage Monitoring Network
Figure D: Wind direction (degrees from North) at Cape Hatteras U.S. Coast Guard Station
SOURCE:
Contrail / North Carolina Rain and Stream Gage Monitoring Network

Of course, this site was not unique. In many areas, the coastal flooding reached 2-3 feet above ground level. What’s more, the arctic system that came behind the winds was cold enough to turn shallow flood waters into dangerously slick ice and slush. The town of Manteo was flooded with about two feet of water, and flooding forced officials to close portions of North Carolina state route 12 (the main route connecting the Outer Banks).

Why the response was remarkable: How partnerships, proactive network maintenance, and automated alerts protect North Carolina communities

When local officials throughout North Carolina face flood threats like this one, many turn to the state’s flood warning system, the North Carolina Flood Inundation Mapping and Alert Network (FIMAN). FIMAN’s mission is to “provide rain and stage gage data, flood inundation maps, flooding impacts and alerts in real time to support risk-based decisions regarding flooding.” AEM’s Contrail platform serves as the central repository where FIMAN’s rain and water level data is consolidated before being packaged and shared with partners throughout the state. The data they collect is made freely available to the public and local governments.

FIMAN has designed its operations to help ensure that they can consistently provide communities and other partners with accurate data when they need it. Here are a few of the distinguishing features of their operational approach:
1
Data sharing

To get access to the broadest possible network of rain and flood sensor data, FIMAN has established data sharing agreements with a wide variety of partners, including the United States Geological Survey (USGS), the National Oceanic and Atmospheric Agency (NOAA), the North Carolina Department of Transportation (DOT), private-sector companies, and local governments. FIMAN even works with the USGS to ensure that they can get access to any rapid-deploy gauges that the USGS may temporarily activate during an event.

2
Network maintenance partnerships

In exchange for access to sensor data, FIMAN provides sensor maintenance services for several of its partners, including local governments and the North Carolina DOT. FIMAN will even share technical expertise with local governments that are looking into installing new sensors.

3
Proactive network maintenance

Regardless of how extensive a flood information network might be, it provides very little help if that data isn’t available when it is most needed. To keep those failures from happening, FIMAN prepares for anticipated flood threats by proactively identifying and repairing any sensors in the vicinity that may need maintenance. Beyond the physical network of sensors and weather stations, FIMAN closely monitors its communication network to ensure that it is prepared for the spikes in network activity that inevitably occur during flood events.

4
Customizable automated alerts

To help ensure that information gets to those who need it when they need it, FIMAN has equipped its flood warning system with automated alerts. Anyone from the public, including local officials, can subscribe to these alerts, and they can customize their alerts to fit their unique needs.

5
Multidimensional analysis

The FIMAN network utilizes a combination of weather stations and water level sensors to bring together a wide range of data points that end users can use to understand and anticipate flood conditions. For example, beyond the usual metrics of water level, rain increments, and rain accumulation, the FIMAN network makes available data regarding wind speeds and wind direction. These additional data points were critical for understanding and anticipating the Outer Banks flood event of December 2022.

Thanks to these practices, the FIMAN network was able to continuously provide information about the Outer Banks flooding as officials needed it, so they could make critical decisions about how to respond. This included making highly sensitive decisions about when and where to close or open roads in an area where a single road closure can cut off entire communities from the outside world.
CHAPTER
0 4
Figure A: Santa Cruz County, CA

Santa Cruz County gets pummeled by atmospheric river storms

Hydrometeorological context

Did you know that flooding has accounted for about one-third of the top natural disasters that Santa Cruz County has experienced in the past 125 years? The county occupies a narrow strip of coastal plain along the northern shore of California’s Monterey Bay and is backed by the Santa Cruz Mountains to the north and east. As you might expect, the county’s coastal location makes it vulnerable to flooding from storm surges and large waves.

The county’s vulnerability to flooding is compounded by the fact that it tends to get far more rain – as much as four times more for any given storm – than its neighboring counties. As storms roll in from the Pacific, they run into the Santa Cruz Mountains. The mountains force the air to lift and cool, thereby turning the water vapor into precipitation over the county.

Figure A: Santa Cruz County, CA
December 2022 – March 2023 atmospheric river storms event

Since December 2022, the county’s flood challenges had been exacerbated by a series of atmospheric rivers that had repeatedly hit the west coast of the United States.

If you aren’t already familiar with them, atmospheric rivers are long, narrow bands of concentrated water vapor in the atmosphere, which form in the tropics and flow eastward across the Pacific Ocean like rivers in the air. When that vapor reaches the mountain ranges of the western U.S., it gets pushed up, which causes it to cool rapidly and turn into precipitation.

NOAA points out that many atmospheric rivers are weak systems that provide beneficial rain and snow. However, the stronger ones may contain an amount of water vapor that is equivalent to as much as 15 times the average flow at the mouth of the Mississippi River. A strong atmospheric river can cover an area up to 375 miles wide and drop as much as 5 inches of rain in a single day.

Like much of California, Santa Cruz County had to deal with more than just one atmospheric river; it had to deal with repeated onslaughts from 31 atmospheric river storms in only three months. Not all of them were major storms, but each one added to the cumulative rainfall, making it ever harder to manage each successive wave of rainfall.

PHOTO:
Courtesy of Santa Cruz County Flood Control
Data from Santa Cruz County’s Flood Monitoring Network tells the story of exactly what happened. A rain gauge, located in the town of Olive Springs, recorded more than 61 inches of total accumulated rainfall from December through March. For perspective, that’s about 3 times the amount of rain recorded a year ago at the same location and over the same timeframe.
Figure B: Accumulated rainfall in Olive Springs, CA
(View data source)
SOURCE:
Contrail / Santa Cruz County Flood Warning System
What’s more, rainfall throughout the county was far from evenly distributed. It came in waves with some waves being bigger than others (see Figure C). The largest wave of rainfall hit toward the end of December and continued through about mid-January.
Figure C: Daily rainfall increments in Olive Springs, CA
(View data source)
SOURCE:
Contrail / Santa Cruz County Flood Warning System
As illustrated in Figure D, water levels in the local creeks and rivers rose and fell with each successive wave of rainfall. The more intense and sustained the wave, the more likely it was to produce flooding. During the largest wave lasting from late December into mid-January, when the area was hit by nine successive atmospheric river storms, Soquel Creek surpassed flood stage on three separate occasions. It surpassed flood stage again during the atmospheric river storm that occurred in mid-March.
Figure D: Soquel Creek water level at Soquel, CA
(View data source)
SOURCE:
Contrail / Santa Cruz County Flood Warning System

Many areas throughout the county shared experiences similar to those of Soquel and Olive Springs. As a result, the county suffered numerous power outages and property damage. While many areas in the state were hit hard, Santa Cruz was among the hardest hit. As of April, while 41 of California’s 58 counties had entered federal emergency declarations, Santa Cruz was one of only three counties to have entered a major disaster declaration.

Why the response was remarkable: How creative data visualization, post-response analysis, and automated alerting helped Santa Cruz County mitigate risk in the most extreme circumstances

To protect residents throughout these events, emergency personnel in the county continued to close roads, issue evacuation orders, perform rescue operations, and open flood shelters as necessary. Many of those actions were guided by flood and weather information coming from Santa Cruz County’s Flood Control.

Flood Control is a division of the county’s Public Works. One of its stated purposes is to “reduce flood risk and to inform emergency managers and the public of real-time flooding potential during storms.” To accomplish this objective, the division maintains the Santa Cruz County Flood Warning System, which utilizes AEM’s Contrail platform to store, analyze, and visualize information about weather and water levels.

PHOTO:
Courtesy of Santa Cruz County Flood Control
To provide emergency managers with accurate and timely information, Flood Control has adopted a number of advantageous practices. These are a few of their most salient practices, even though the best of practices can be pushed to their limits in such extreme circumstances.
1
Multidimensional risk assessment

To anticipate what may happen to the water level at any given site, the team factors in a wide range of variables, such as cumulative rainfall, incremental rainfall, current water level, and upstream water levels. Until the atmospheric river storms, this approach worked well for the county.

2
Automated advanced alerts

Flood Control has set up the county’s Flood Warning System to provide automated alerts, not only when water levels reach flood stage, but also at defined pre-flood action stages. The action stage gives the team time to respond to impending flood threats before they become a reality. It also triggers more formalized monitoring and reporting protocols from Flood Control to Emergency Management; that reporting supplements Emergency Management’s direct access to the Flood Warning System.

The advanced alerts proved to be especially beneficial on the morning of December 31. Although no one was expecting flooding to occur in Watsonville, alarms in Corralitos Creek were triggered around 4 am as the water level reached action stage. Then, a little over eight hours after the initial alarms, the water level finally passed moderate flood stage and began spilling over into Watsonville. Even without anticipating the floods ahead of time, the alarms gave county personnel plenty of advance notice to notify citizens, take whatever preventative measures they could, and prepare their response.

Figure E: Corralitos Creek water level at Watsonville, CA
(View data source)
SOURCE:
Contrail / Santa Cruz County Flood Warning System
3
Looking beyond county boundaries

Where it’s feasible to do so, the county’s Flood Warning System even incorporates data from rain and flood sensors that lie beyond county lines. Looking at rain and water levels in areas that lie upstream from the county enables them to better anticipate possible flooding.

4
Eyes in the field

Although the county’s emergency managers rely primarily on flood and weather data from Contrail to guide their decision-making, they also recognize that they cannot rely solely on that data. They deploy eyes in the field to help them identify problem areas where sensors may be returning inaccurate readings or may simply not be telling the full story of what is happening in the field.

A perfect example goes back to the March atmospheric river storm that ultimately resulted in the failure of a Pajaro River levee. Since that flood event occurred before water levels could rise to levee height, it could not have been detected merely by the water level data available in Contrail. Patrols in the field played a vital role in uncovering the impending failure before it occurred, so evacuation orders could be issued and citizens could be alerted in a timely manner.

5
Post-response evaluation and analysis

Following their response to a flood event, the Flood Control team looks at what went right and what went wrong, so they can improve their response to the next event. This practice proved to be especially beneficial throughout the repeated onslaughts of the atmospheric river storms.

Following the very first storm at the end of December, the team’s post-response analysis helped them recognize the need for hydrological modeling to provide more accurate flood predictions under the extreme circumstances created by intense atmospheric river storms.

To compensate until such models could be developed, the Flood Control team put together new dashboards (see Figure F) that enabled the Emergency Management teams to more readily see the close relationship between water levels and incremental rainfall. Although the new dashboards did not objectively quantify the relationships between rainfall and water levels, the visualizations of those relationships at least made them more intuitive. Basing decision-making on these intuitive visualizations was, if not perfect, at least a step in the right direction.

Figure F: Sample dashboard showing San Lorenzo River water level with hourly rain increments
(View data source)
SOURCE:
Contrail / Santa Cruz County Flood Warning System
CHAPTER
0 5

About the report

Why we created this report

We’ve created this report to familiarize you with the current state of best practices for managing flood warning systems. By reading it, you will gain a much better understanding of the best practices that are currently being deployed by managers of some the leading flood warning systems in the United States. And you will walk away with a much better sense of how those practices can be adapted to your own flood warning system.

We explore three different flood warning systems that have been developed in response to very different hydrometeorological challenges and within different organizational structures. We look at each system in action as it responds to a specific type of flood event. And through our contextual analysis, we uncover some of the distinguishing features that help make each of these flood warning systems so effective.

We bring it all together by enumerating several of the best practices that set today’s leading flood warning systems apart from others. The difference is that with the contextual understanding provided by our case studies, you get a much more nuanced appreciation for how these best practices can be adapted to fit a variety of different needs and situations, including your own.

About the creators

AEM is empowering communities and organizations to survive and thrive in the face of escalating environmental threats like floods, wildfires, and severe weather. Our portfolio of innovative technologies and expert services delivers essential environmental insights, so our clients can take decisive action and drive better outcomes.

About the data

The data visualizations used throughout this report, as well as some flood imagery, are drawn from AEM’s Contrail software platform. The platform delivers automated real-time data collection, processing, visualization, and alerting of hydro-meteorological and environmental sensor data to support a wide variety of operations, including flood warning, dam safety, reservoir gate operations, road weather, and more. The advanced tools within Contrail deliver situational awareness at a glance to support mission-critical decisions that often have to be made at a moment’s notice.