2022 United States
Lightning Report

Talk to a lightning expert

Total lightning counts

Total lightning is the combination of all in-cloud and cloud-to-ground lightning activity.
86,547,681
Total lightning flashes
A lightning flash is a collection of pulses close in space and time that approximate the continuous ionized channels of a complete bolt of lightning.
64,247,577
In-cloud
|
74%
In-cloud lightning occurs between opposite charges within a thunderstorm cloud.
22,024,813
Cloud-to-ground
|
26%
Cloud-to-ground lightning occurs between opposite charges in a cloud and on the ground.
572,995,201
Total lightning pulses
A lightning pulse is a surge of electric current in lightning, usually accompanied by a burst of light.
522,483,107
In-cloud
|
91%
48,391,604
Cloud-to-ground
|
9%
Our Take

Overall, the U.S. experienced nearly 87 million total lightning flashes in 2022, which averages out to about 240 flashes per day or about 25 flashes for every square mile.

Those flashes were comprised of nearly 573 million lightning pulses, an average of almost 7 pulses per flash of lightning.

Total lightning flash density by state

Flash density refers to the number of lightning flashes per square mile per year. When comparing regions of different sizes (like Texas and Maryland), raw flash counts can misleadingly skew the comparison in favor of the larger region. Density comparisons eliminate this skewing.

Top 10 states

FLASH DENSITY 103 72 61 55 54 54 52 51 50 47
TOTAL FLASHES 5,519,321 3,089,147 2,842,370 4,216,455 2,751,821 4,409,099 2,702,451 2,913,681 3,432,347 1,421,092
PULSE: FLASH RATIO 11:1 5:1 5:1 4:1 6:1 7:1 6:1 9:1 8:1 7:1
TOTAL PULSES 62,338,764 14,883,840 13,625,433 17,194,602 16,680,151 28,865,364 15,487,095 24,857,309 28,238,710 9,289,474
Our Take

The data shows that Florida had the most concentrated lightning activity, followed by Louisiana and Mississippi.

The data also shows how volume comparisons can be skewed by differences in regional size. Although the lightning flash densities of Nebraska and Kansas trail far behind those of Mississippi and Louisiana, Nebraska and Kansas experienced significantly greater total volumes of lightning pulses.

The data even shows how pulse counts can be skewed by regional differences in the extent and energy of lightning flashes. Although Louisiana had significantly more flash density and flash volume than Georgia, it experienced fewer lightning pulses because its average lightning flash was less extensive and/or less energetic (i.e., comprised of fewer pulses).

Total lightning flash density by county

Top 10 counties

FLASH DENSITY 300 278 203 184 169 162 156 154 153 145
TOTAL FLASHES 4,602 104,926 55,576 143,896 131,763 110,182 158,916 85,864 150,277 64,374
PULSE: FLASH RATIO 16:1 4:1 11:1 13:1 4:1 15:1 12:1 13:1 12:1 11:1
TOTAL PULSES 75,464 466,257 614,206 1,837,956 508,333 1,616,949 1,896,427 1,120,762 1,823,474 721,737
Our Take
When we take a more granular look at the county level, we can see that most counties in the U.S. experienced relatively low concentrations of lighting activity in 2022. Not surprisingly, 6 Florida counties made the top-10 list of counties with the densest lightning activity. However, the county with the densest lightning activity was Poquoson City, Va., with an average of 300 lightning flashes per square mile. Poquoson City is situated near the mouth of the Chesapeake Bay, a region that the National Park Service reports has experienced greater precipitation extremes and a 10% increase in annual precipitation.

Dangerous Thunderstorm Alerts

Dangerous Thunderstorm Alerts (DTAs) are AEM’s patented severe weather warnings, which notify users of incoming storms up to 45 minutes before storm arrival.
Dangerous Thunderstorm Alerts
Our Take
AEM issued 54,242 Dangerous Thunderstorm Alerts in 2022. This map, which shows the density of this year’s DTAs, draws attention to the significant amount of severe storm activity that took place across the Great Plains and into the Upper Midwest.

Total thunder hours by state

A thunder hour represents any given hour in which lightning was detected within range of a certain location. Since a typical thunderstorm usually lasts for an hour or less, the thunder hour provides an ideal level of granularity for measuring the “storminess” of an area. Other metrics tend to be too sensitive or not sensitive enough.

Top 10 State Ranking

Our Take

In addition to the usual hotbeds of lightning activity throughout Florida, the Southeast, and Texas, it was surprising to see Hawaii rank so high for total thunder hours. After all, this state has one of the lowest lightning densities in the country. Part of the explanation for this apparent discrepancy is that Hawaii’s tropical ocean climate results in frequent thunderstorms on and around the island chain, which generally have much less lightning activity than the storms we see across much of the continental United States.

Hawaii illustrates why thunder hours are a useful supplemental data point to flash density and volume. This metric helps us to understand storm frequency – a dimension not fully captured by measurements of lightning volume and lightning density.

Total thunder hours by county

TOP 10 COUNTY RANKING

Our Take

When we take a more granular look at the county level, the rankings continue to reinforce the importance of thunder hours as a supplemental metric for measuring storm frequency. Although Florida counties dominate the top 10 for most thunder hours, we see Honolulu, Hawaii, ranking second overall.

What’s more, Arizona, another state with a comparatively low amount of lighting activity per square mile, had two counties rank in the top 10 for most thunder hours (likely driven by the state’s monsoon season, which can bring frequent storms with minimal lightning activity).

Thunder hour anomalies

Thunder hour anomalies indicate the amount of variation between our 9-year average and the number of thunder hours observed in the past year. We look at thunder hour anomalies to provide a better sense of how the past year deviated from the climatological trend. Simplistic year-over-year comparisons of thunder hours can introduce extraneous noise because each year in the comparison (not just the most recent year) can deviate to a greater or lesser extent from the overall trend.
Thunder hour anomalies
Our Take
The map shows above-average storm activity throughout the southeast, across Arizona, and along most of the Canadian border. However, storm activity was well below average throughout Texas, the southern Great Plains, and into portions of the Midwest. Positive anomalies throughout the Southwest were tied to a very active monsoon season in 2022. Negative anomalies in the Great Plains were related to drought conditions that were partly caused by a persistent La Niña pattern.

2022 lightning highlights

Lightning data provides important insights into weather and climate across the United States. In this portion of the report, we will focus on the close relationships between lightning and some interesting meteorological events. The following case studies discuss several interesting weather events from 2022 and their noteworthy lightning activity.
California fires
California escapes disaster after exceptional dry lightning storm ignites fires
California fires
Why Hurricane Ian’s unusual lightning activity was a bad omen
California fires
Great Lakes thundersnow buries Buffalo

As Californians awaited the first day of summer, they were also bracing for a significant storm system to roll through the state, fueled partly by monsoonal moisture and partly by a disturbance in the jet stream moving across the region. Although the thunderstorms in the forecast were expected to produce very little rain, meteorologists warned they could still produce dangerous lightning.

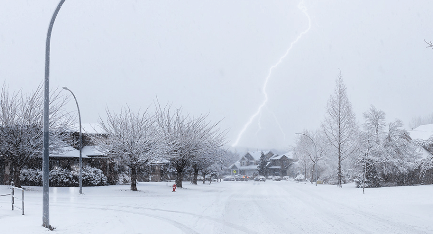
While there is no such thing as safe lightning, so-called “dry lightning” (i.e., lightning accompanied by rain that evaporates before it hits the ground) is especially dangerous because it brings heightened wildfire risk. And, in drought-stricken California, that risk is already high enough without lightning.

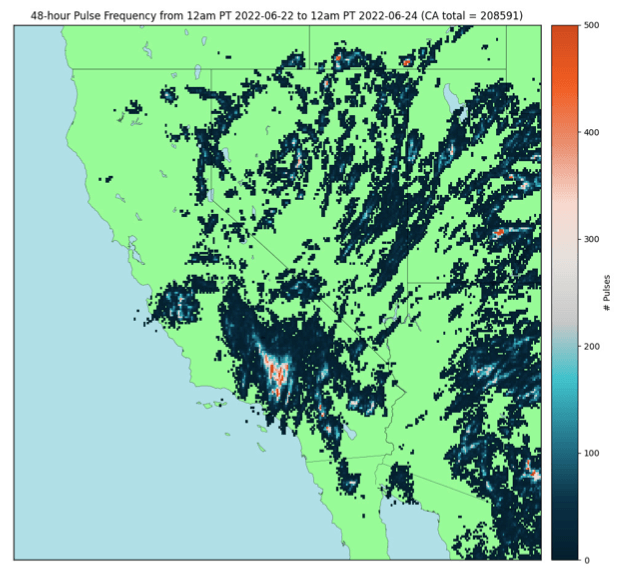
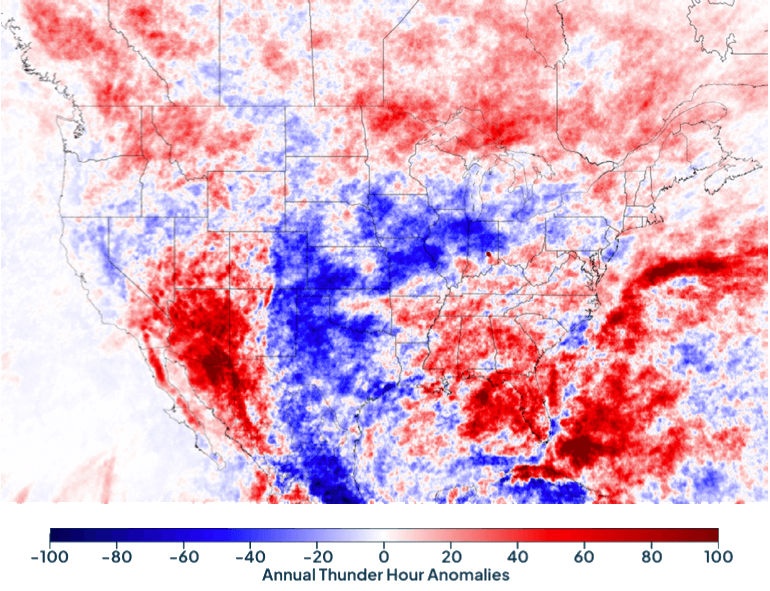
When the storm system finally hit, from June 22 to June 23, it produced more than 208,000 total lightning pulses across the state, including more than 33,000 cloud-to-ground pulses. It was the most lightning the state had seen in a single day in nearly five years.

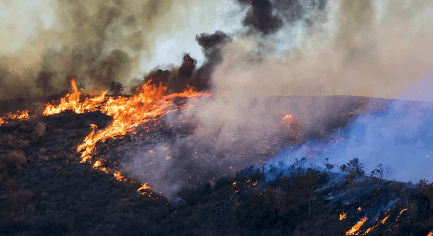
Wildfire Today reported that the storm did, in fact, ignite a number of small fires. The largest of these was the Thunder Fire, which burned about 2,500 acres before being fully contained. Fortunately, firefighters were able to contain most of the fires without too much difficulty, limiting the total burn area to less than 4,000 acres.

While no amount of destruction is ever good, Californians were fortunate that this incredible amount of lightning did not produce a more incredible amount of fire. For comparison, in August 2020, a similar “dry lightning” storm ignited more than 650 wildfires across northern California, including the August Complex Fire, which became the largest fire in state history. Together, those fires burned an estimated 1.5-2.1 million acres (about the area of Connecticut).

Three factors combined to prevent the outcome of the June 2022 lightning storm from being much worse:

  1. Rain is thought to have reached the ground along with some of the strikes, especially at higher elevations.
  2. The active North American Monsoon winds brought high relative humidity to the region, making fuels less receptive to ignition.
  3. June is still early in the fire season, before fuel moisture drops to critically low levels.

After striking the Florida coastline on September 28, Hurricane Ian took the lives of more than 100 Floridians, making it the deadliest tropical storm to hit the state since the Great Labor Day Hurricane of 1935.

The devastation was made worse by the fact that Ian went through a period of rapid intensification only hours before hitting the coastline. Over a three-hour period, Ian’s wind speeds increased from 120 mph to 155 mph as measured by AEM’s weather network – leaving it only a few miles per hour short of the most dangerous Category 5 classification on the Saffir-Simpson scale.

Ian was unusual in other ways too. Hurricanes typically don’t produce prolonged lightning activity in and around their eyewalls. Ian did. As the storm approached and struck Florida, AEM’s network of weather stations and lightning sensors recorded no less than 98,176 lightning flashes and 839,858 lightning pulses over 48 hours.

There’s an interesting connection between Ian’s unusual lightning activity and its exceptional strength. Both are tied to a process called eyewall replacement.

It’s a natural part of the hurricane lifecycle for the eyewall to weaken over time. As this happens, a new ring of wind and rain will sometimes contract inward and surge upward to replace the old eyewall. This upward surge can enable the clouds to get tall enough at a fast enough rate to temporarily develop ice crystals in them, and those colliding crystals can generate the static charge needed to produce lightning. Unfortunately, this inward and upward movement also causes the new eyewall to spin even faster (like a figure skater pulling their arms inward).

As a result, surges in lightning activity in the storm’s inner core and eyewall tend to be associated with periods of rapid intensification. And that’s exactly what we saw happen with Hurricane Ian. Just before the storm made landfall in Florida, we saw a spike in lightning activity accompanied by a period of rapid intensification.

On the afternoon of November 17, residents of northwestern New York found themselves pummeled by snowfall – at some points, more than three inches per hour. By the time the clouds finally cleared on November 18, some areas had been blanketed with more than six feet. The city of Buffalo more than doubled its previous record for maximum snowfall in a day, and the town of Orchard Park broke the state record for most snowfall in a 24-hour period.

But this storm delivered more than just record-breaking snowfall. It delivered a rare lightshow of more than 1,000 lightning pulses in 24 hours.

Thundersnow, as it is called, is a relatively rare occurrence. It’s been estimated that thundersnow accounts for less than 0.1% of all U.S. snowstorms. The reason for the rarity is that lightning and snowstorms are generally caused by very different atmospheric conditions.

Lightning is caused by conditions of atmospheric instability in which warm air rises rapidly into the cooler air above it. In contrast, most snowfall is generated under conditions that tend to produce atmospheric stability, namely, the air near the ground being almost as cold as the air above it. For comparison, a typical thunderstorm has air rising at more than ten miles per hour, while the most severe snow bands tend to have air rising at only two miles per hour.

However, some snowstorms, such as lake effect snowstorms, can form when cold air near the surface is heated while moving over relatively warm waters. If the air above the surface is cold enough, the newly warmed layer of air can rise rapidly, producing a tall column that looks more like a thunderstorm cloud than a flat snow cloud. That same scenario can produce the atmospheric instability needed to generate lightning; that’s when our snowstorm becomes thundersnow.

Unfortunately, the same atmospheric instability that gives rise to thundersnow also tends to result in heavier snow and higher snowfall rates. Wherever you see thundersnow, there’s a high probability for significant snow accumulation – just as they experienced in northwestern New York.

About this report

The 2022 U.S. Lightning Report was prepared by our team at AEM using our proprietary Earth Networks Total Lightning Network® (ENTLN).

The ENTLN has been developed specifically to detect lightning in real time and to provide advanced warnings for severe weather events that could threaten public safety and operational efficiency. The ENTLN is the most extensive and technologically advanced lightning network in the world. With more than 1,800 sensors, the network provides exceptional baseline lightning detection around the globe. In fact, with recent algorithm changes in 2021, the ENTLN detects 30-50% more lightning worldwide than ever before. In regions with higher sensor density, the network’s lightning detection efficiency climbs above 95%.

The report includes in-cloud, cloud-to-ground, and total lightning data throughout 2022 from the United States and the surrounding bodies of water. Counts, densities, rankings, Dangerous Thunderstorm Alerts (DTAs), and thunder hours in this report are from January 1, 2022, to December 31, 2022.

In addition to the interactive version of the U.S. Lightning Report, which you are now reading, we are pleased also to offer the report as a downloadable ebook.

GET IN TOUCH!
Talk to a lightning expert
Every day we help companies protect assets, improve operations and plan for every environmental event. Let us show you how.