Lightning Report
Learn how lightning risks are evolving throughout the United States and what it means for individual states, counties, and industries.
Snapshot
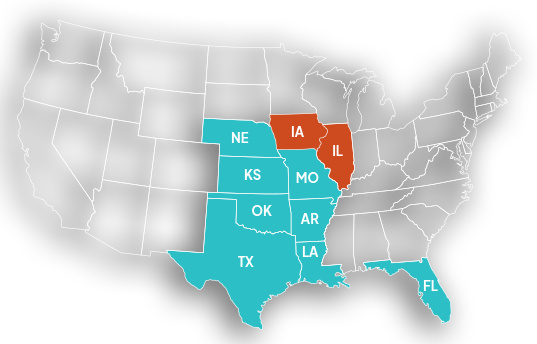
A YEAR OF SURPRISES
In a surprising twist, Illinois and Iowa join the top ten states with the most lightning activity per square mile. This remarkable turn of events upends decades of established weather patterns and could signal a long-term change to the nation's severe weather distribution.
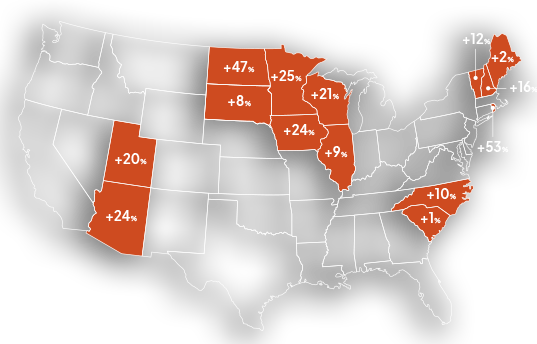
WHERE LIGHTNING SURGED
Depending on where you lived, severe weather trends likely looked very different in 2024. While the overall country saw a 17% decline in the total number of lightning flashes, several states, particularly in the Upper Midwest and Eastern Seaboard, saw significant increases.
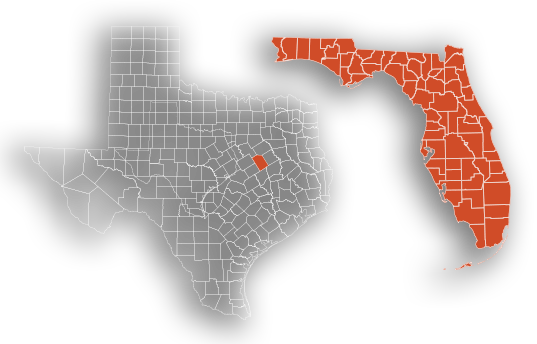
THE LIGHTNING CAPITALS OF 2024
Although Florida remains the lightning capital of the U.S. with an average of 76 flashes per square mile, the county with the densest lightning activity is actually in Texas (Limestone County with an average of 125 flashes per square mile).
National metrics
State metrics
As the lightning capital of the United States, Florida continues to have the highest concentration of lightning activity in the U.S.
Nine of the top 10 states with the highest concentrations of lightning are situated in areas known for their lightning activity, including the Gulf Coast, the Southeast, and the Great Plains regions. The only state that is not from one of these three regions is Missouri, which dislodged South Carolina from the top 10 this year. More than two dozen counties across Missouri experienced above-average rainfall over the past year.
As the lightning capital of the U.S., seven of the top 10 counties with the highest concentration of lightning activity are in Florida. But the top county with the single-greatest density of lightning activity is St. Bernard Parish in Louisiana.
Besides Florida, the remaining three spots in the top 10 are occupied by three counties in Louisiana and Mississippi (all located along the Gulf Coast in the Mississippi Delta region). Last year’s top contender, Poquoson City, Virginia, disappeared completely from the top 10, which underscores the extreme concentration of lightning in the Florida and Gulf Coast counties.
As the lightning capital of the U.S., five of the top 10 counties with the most thunder hours are in Florida. The remaining counties, however, are not from any of the lightning hotspots in the Gulf Coast or Southeast. They are from Hawaii, Wyoming, Nevada, and Arizona.
In keeping with the rest of Hawaii, Honolulu County’s thunder hours can be traced to the area’s large number of storms with mild lightning activity. The remaining counties are among the top 30 in land area, which illustrates how the size of larger areas can skew lightning counts in their favor, even when they have lower concentrations of lightning activity.
Dangerous Thunderstorm Alerts (DTAs) are AEM’s patented severe weather warnings. When the lightning flash rate of a thunderstorm cell exceeds a high enough threshold to indicate that it poses a material threat to life and property, a DTA is automatically issued. The number of DTAs issued in an area correlates closely with the number of high-intensity thunderstorms.
As one might expect, Texas leads the list because of its large land area. But the other states on this list also appear in the top ten for lightning flash density. In other words, the states with the highest concentrations of lightning also tend to have the largest numbers of intense thunderstorms.
As the lightning capital of the United States, Florida continues to have the highest concentration of lightning activity in the U.S.
Nine of the top 10 states with the highest concentrations of lightning are situated in areas known for their lightning activity, including the Gulf Coast, the Southeast, and the Great Plains regions. The only state that is not from one of these three regions is Missouri, which dislodged South Carolina from the top 10 this year. More than two dozen counties across Missouri experienced above-average rainfall over the past year.
While lightning flash density indicates the concentration of lightning activity in a region, total thunder hours indicate how that lightning was distributed over time. Since the average storm lasts for about an hour, the thunder hour provides an ideal level of granularity for estimating the “storminess” of an area or how frequently an area must deal with lightning risk.
It’s no surprise that states like Texas (due to its size) and Florida (as the lightning capital of the U.S.) rank among the top states with the most thunder hours. But Hawaii and California are among the top 10 states with the most thunder hours, even though they are among the bottom 10 states for lightning flash density. These are states that tend to have large numbers of storms, but each storm tends to have less lightning activity.
County metrics
As the lightning capital of the United States, Florida continues to have the highest concentration of lightning activity in the U.S.
Nine of the top 10 states with the highest concentrations of lightning are situated in areas known for their lightning activity, including the Gulf Coast, the Southeast, and the Great Plains regions. The only state that is not from one of these three regions is Missouri, which dislodged South Carolina from the top 10 this year. More than two dozen counties across Missouri experienced above-average rainfall over the past year.
As the lightning capital of the U.S., seven of the top 10 counties with the highest concentration of lightning activity are in Florida. But the top county with the single-greatest density of lightning activity is St. Bernard Parish in Louisiana.
Besides Florida, the remaining three spots in the top 10 are occupied by three counties in Louisiana and Mississippi (all located along the Gulf Coast in the Mississippi Delta region). Last year’s top contender, Poquoson City, Virginia, disappeared completely from the top 10, which underscores the extreme concentration of lightning in the Florida and Gulf Coast counties.
While lightning flash density indicates the concentration of lightning activity in a region, total thunder hours indicate how that lightning was distributed over time. Since the average storm lasts for about an hour, the thunder hour provides an ideal level of granularity for estimating the “storminess” of an area or how frequently an area must deal with lightning risk.
It’s no surprise that states like Texas (due to its size) and Florida (as the lightning capital of the U.S.) rank among the top states with the most thunder hours. But Hawaii and California are among the top 10 states with the most thunder hours, even though they are among the bottom 10 states for lightning flash density. These are states that tend to have large numbers of storms, but each storm tends to have less lightning activity.
Industry highlights
- Airports
- Wind farms
- Golf courses
| Airport | Airport Code | 2023 Passenger Traffic | Total Pulses | Total Flashes |
|---|---|---|---|---|
| Hartsfield–Jackson Atlanta International Airport (GA) | ATL | 50,950,068 | 63,937 | 9,699 |
| Los Angeles International Airport (CA) | LAX | 40,956,673 | 17 | 11 |
| Dallas/Fort Worth International Airport (TX) | DFW | 39,246,212 | 400,666 | 38,379 |
| Denver International Airport (CO) | DEN | 37,863,967 | 10,205 | 6,067 |
| O'Hare International Airport (IL) | ORD | 35,843,104 | 212,721 | 22,150 |
| John F. Kennedy International Airport (NY) | JFK | 30,804,355 | 105,158 | 4,787 |
| Orlando International Airport (FL) | MCO | 28,033,205 | 304,357 | 36,762 |
| Harry Reid International Airport (NV) | LAS | 27,896,199 | 1,674 | 651 |
| Charlotte Douglas International Airport (NC) | CLT | 25,896,224 | 92,640 | 12,704 |
| Miami International Airport (FL) | MIA | 24,717,048 | 270,433 | 35,469 |
| Seattle–Tacoma International Airport (WA) | SEA | 24,594,210 | 910 | 149 |
| Newark Liberty International Airport (NJ) | EWR | 24,575,320 | 171,078 | 8,366 |
| San Francisco International Airport (CA) | SFO | 24,191,159 | 106 | 45 |
| Phoenix Sky Harbor International Airport (AZ) | PHX | 23,880,504 | 4,262 | 2,020 |
| George Bush Intercontinental Airport (TX) | IAH | 22,228,844 | 316,242 | 43,725 |
| Logan International Airport (MA) | BOS | 19,962,678 | 14,386 | 2,005 |
| Fort Lauderdale–Hollywood International Airport (FL) | FLL | 17,063,063 | 253,871 | 26,564 |
| Minneapolis–Saint Paul International Airport (MN) | MSP | 17,019,128 | 24,603 | 10,774 |
| LaGuardia Airport (NY) | LGA | 16,173,073 | 128,383 | 6,710 |
| Detroit Metropolitan Airport (MI) | DTW | 15,378,601 | 67,947 | 10,890 |
| Philadelphia International Airport (PA) | PHL | 13,656,189 | 155,779 | 10,000 |
| Salt Lake City International Airport (UT) | SLC | 12,905,368 | 18,341 | 4,671 |
| Baltimore/Washington International Airport (MD) | BWI | 12,849,721 | 226,456 | 9,582 |
| Ronald Reagan Washington National Airport (VA) | DCA | 12,365,030 | 126,058 | 5,785 |
| San Diego International Airport (CA) | SAN | 12,190,183 | 12 | 6 |
| Wind Farm | Capacity (MW) | Total Pulses | Total Flashes |
|---|---|---|---|
| SunZia Wind and Transmission (NM) | 3,500 | 1,451 | 868 |
| Alta Wind Energy Center (CA) | 1,548 | 1,325 | 280 |
| Western Spirit Wind Farm (NM) | 1,050 | 37,586 | 14,877 |
| Traverse Wind Energy Center (OK) | 998 | 260,038 | 40,825 |
| Los Vientos Wind Farm (TX) | 912 | 84,900 | 26,885 |
| Shepherds Flat Wind Farm (OR) | 845 | 865 | 235 |
| Meadow Lake Wind Farm (IN) | 801 | 207,872 | 20,664 |
| Roscoe Wind Farm (TX) | 781 | 147,613 | 25,307 |
| Javelina Wind Energy Center (TX) | 749 | 71,136 | 17,645 |
| Horse Hollow Wind Energy Center (TX) | 736 | 279,745 | 46,615 |
| Tehachapi Pass Wind Farm (CA) | 690 | 1,406 | 326 |
| Capricorn Ridge Wind Farm (TX) | 662 | 107,126 | 22,854 |
| San Gorgonio Pass Wind Farm (CA) | 619 | 3,183 | 618 |
| Peñascal Wind Farm (TX) | 605 | 118,637 | 21,791 |
| Limon Wind Energy Center (CO) | 601 | 56,200 | 28,021 |
| Fowler Ridge Wind Farm (IN) | 600 | 211,493 | 21,145 |
| Rush Creek Wind Project (CO) | 600 | 46,635 | 24,038 |
| Sweetwater Wind Farm (TX) | 585 | 132,668 | 22,895 |
| Altamont Pass Wind Farm (CA) | 576 | 87 | 49 |
| Flat Ridge Wind Farm (KS) | 570 | 191,654 | 36,038 |
| Cedar Creek Wind Farm (CO) | 550 | 38,832 | 22,041 |
| Cedar Springs Wind Farm (WY) | 533 | 11,918 | 4,074 |
| Buffalo Gap Wind Farm (TX) | 523 | 190,334 | 32,173 |
| Spinning Spur Wind Farm (TX) | 516 | 70,306 | 26,553 |
| Highland Wind Energy Center (IO) | 502 | 48,297 | 19,342 |
| Course | Golf.com Ranking | Total Pulses | Total Flashes |
|---|---|---|---|
| Pine Valley (NJ) | 1 | 126,656 | 6,660 |
| Cypress Point (CA) | 2 | 8 | 7 |
| Shinnecock Hills (NY) | 3 | 37,913 | 2,019 |
| National Golf Links of America (NY) | 4 | 41,253 | 2,168 |
| Oakmont (PA) | 5 | 113,348 | 7,185 |
| Augusta National (GA) | 6 | 89,163 | 12,006 |
| Sand Hills (NE) | 7 | 14,266 | 7,438 |
| Merion, East (PA) | 8 | 100,965 | 7,484 |
| Pebble Beach (CA) | 9 | 10 | 8 |
| Los Angeles, North (CA) | 10 | 102 | 46 |
| Fishers Island (NY) | 11 | 29,505 | 1,629 |
| Chicago Golf Club (IL) | 12 | 91,564 | 12,136 |
| Pinehurst, No. 2 (NC) | 13 | 56,247 | 10,368 |
| Riviera (CA) | 14 | 105 | 47 |
| Friar's Head (NY) | 15 | 36,191 | 1,754 |
| Prairie Dunes (KS) | 16 | 66,072 | 13,869 |
| Seminole (FL) | 17 | 172,457 | 15,972 |
| Winged Foot, West (NY) | 18 | 191,145 | 9,147 |
| Pacific Dunes (OR) | 19 | 417 | 174 |
| Oakland Hills, South (MI) | 20 | 43,160 | 7,415 |
| The Country Club, Clyde/Squirrel (MA) | 21 | 12,284 | 1,581 |
| San Francisco (CA) | 22 | 18 | 6 |
| Crystal Downs (MI) | 23 | 7,927 | 1,535 |
| Southern Hills (OK) | 24 | 90,828 | 16,980 |
| Shoreacres (IL) | 25 | 144,423 | 13,977 |
Takeaways
In this video, Dr. Elizabeth DiGangi expands on key takeaways from this year’s report. Dr. DiGangi is the lead data scientist and author of AEM’s 2024 Lightning Report.
This year’s report data revealed a shockingly high concentration of lightning and severe weather in the Upper Midwest. Dr. DiGangi dives into how this unusual shift challenges decades of established weather patterns and could signal long-term changes in severe weather distribution across the United States.
The goal of this report is to help companies and communities understand and prepare for evolving lightning risks throughout the United States.
About this report
The 2024 U.S. Lightning Report was prepared by our team at AEM using our proprietary Earth Networks Total Lightning Network® (ENTLN).
The ENTLN has been developed specifically to detect lightning in real time and to provide advanced warnings for severe weather events that could threaten public safety and operational efficiency. It is the most extensive and technologically advanced lightning network in the world. With more than 1,800 sensors, it provides exceptional baseline lightning detection around the globe. In regions with higher sensor density, the network’s lightning detection efficiency climbs above 95%.
The report includes in-cloud, cloud-to-ground, and total lightning data throughout 2024 from the United States and the surrounding bodies of water. Counts, densities, rankings, Dangerous Thunderstorm Alerts (DTAs), and thunder hours in this report are from January 1, 2024, to December 31, 2024. The data in this report has been thoroughly reviewed and updated to reflect the most accurate information available as of 01/21/25.